This is just a summary of a tutorial from https://blog.christophersmart.com/2019/09/08/setting-up-a-monitoring-host-with-prometheus-influxdb-and-grafana/ but without using Docker and CentOS.
I use the Debian 10 distribution and as much as possible I will use the default packages from the APT package manager.
Installation and Configuration of Prometheus and InfluxDB
Open your preferred shell and type the following to install the packages:
$ sudo apt update
$ sudo apt install prometheus influxdb influxdb-client
Sample output:
Reading package lists... Done
Building dependency tree
Reading state information... Done
The following additional packages will be installed:
fonts-glyphicons-halflings libio-pty-perl libipc-run-perl libjs-bootstrap libjs-d3 libjs-eonasdan-bootstrap-datetimepicker libjs-jquery-hotkeys
libjs-moment libjs-moment-timezone libjs-mustache libjs-rickshaw moreutils prometheus-node-exporter
Suggested packages:
libtime-duration-perl
The following NEW packages will be installed:
fonts-glyphicons-halflings influxdb libio-pty-perl libipc-run-perl libjs-bootstrap libjs-d3 libjs-eonasdan-bootstrap-datetimepicker libjs-jquery-hotkeys
libjs-moment libjs-moment-timezone libjs-mustache libjs-rickshaw moreutils prometheus prometheus-node-exporter influxdb-client
0 upgraded, 15 newly installed, 0 to remove and 2 not upgraded.
Need to get 21.2 MB of archives.
After this operation, 186 MB of additional disk space will be used.
Do you want to continue? [Y/n] y
Get:1 http://httpredir.debian.org/debian buster/main amd64 libjs-jquery-hotkeys all 0~20130707+git2d51e3a9+dfsg-2 [11.3 kB]
Get:2 http://httpredir.debian.org/debian buster/main amd64 fonts-glyphicons-halflings all 1.009~3.4.1+dfsg-1 [164 kB]
Get:3 http://httpredir.debian.org/debian buster/main amd64 libio-pty-perl amd64 1:1.08-1.1+b5 [33.7 kB]
Get:4 http://httpredir.debian.org/debian buster/main amd64 libipc-run-perl all 20180523.0-1 [101 kB]
Get:5 http://httpredir.debian.org/debian buster/main amd64 libjs-bootstrap all 3.4.1+dfsg-1 [173 kB]
Get:6 http://httpredir.debian.org/debian buster/main amd64 libjs-d3 all 3.5.17-2 [132 kB]
Get:7 http://httpredir.debian.org/debian buster/main amd64 libjs-moment all 2.24.0+ds-1 [142 kB]
Get:8 http://httpredir.debian.org/debian buster/main amd64 libjs-eonasdan-bootstrap-datetimepicker all 4.17.47-3 [27.4 kB]
Get:9 http://httpredir.debian.org/debian buster/main amd64 libjs-moment-timezone all 0.5.23+dfsg1-1 [456 kB]
Get:10 http://security.debian.org/debian-security buster/updates/main amd64 influxdb amd64 1.6.4-1+deb10u1 [5,091 kB]
Get:11 http://httpredir.debian.org/debian buster/main amd64 libjs-mustache all 2.3.2-1 [24.3 kB]
Get:12 http://httpredir.debian.org/debian buster/main amd64 libjs-rickshaw all 1.5.1.dfsg-2 [710 kB]
Get:13 http://httpredir.debian.org/debian buster/main amd64 moreutils amd64 0.62-1 [73.1 kB]
Get:14 http://httpredir.debian.org/debian buster/main amd64 prometheus amd64 2.7.1+ds-3+b11 [11.0 MB]
Get:15 http://httpredir.debian.org/debian buster/main amd64 prometheus-node-exporter amd64 0.17.0+ds-3+b11 [3,131 kB]
Get: 16 http://security.debian.org/debian-security buster/updates/main amd64 influxdb-client amd64 1.6.4-1+deb10u1 [1,960 kB]
Fetched 21.2 MB in 1min 35s (224 kB/s)
Preconfiguring packages ...
Selecting previously unselected package libjs-jquery-hotkeys.
(Reading database ... 378186 files and directories currently installed.)
Preparing to unpack .../00-libjs-jquery-hotkeys_0~20130707+git2d51e3a9+dfsg-2_all.deb ...
Unpacking libjs-jquery-hotkeys (0~20130707+git2d51e3a9+dfsg-2) ...
Selecting previously unselected package fonts-glyphicons-halflings.
Preparing to unpack .../01-fonts-glyphicons-halflings_1.009~3.4.1+dfsg-1_all.deb ...
Unpacking fonts-glyphicons-halflings (1.009~3.4.1+dfsg-1) ...
Selecting previously unselected package libio-pty-perl.
Preparing to unpack .../02-libio-pty-perl_1%3a1.08-1.1+b5_amd64.deb ...
Unpacking libio-pty-perl (1:1.08-1.1+b5) ...
Selecting previously unselected package libipc-run-perl.
Preparing to unpack .../03-libipc-run-perl_20180523.0-1_all.deb ...
Unpacking libipc-run-perl (20180523.0-1) ...
Selecting previously unselected package libjs-bootstrap.
Preparing to unpack .../04-libjs-bootstrap_3.4.1+dfsg-1_all.deb ...
Unpacking libjs-bootstrap (3.4.1+dfsg-1) ...
Selecting previously unselected package libjs-d3.
Preparing to unpack .../05-libjs-d3_3.5.17-2_all.deb ...
Unpacking libjs-d3 (3.5.17-2) ...
Selecting previously unselected package libjs-moment.
Preparing to unpack .../06-libjs-moment_2.24.0+ds-1_all.deb ...
Unpacking libjs-moment (2.24.0+ds-1) ...
Selecting previously unselected package libjs-eonasdan-bootstrap-datetimepicker.
Preparing to unpack .../07-libjs-eonasdan-bootstrap-datetimepicker_4.17.47-3_all.deb ...
Unpacking libjs-eonasdan-bootstrap-datetimepicker (4.17.47-3) ...
Selecting previously unselected package libjs-moment-timezone.
Preparing to unpack .../08-libjs-moment-timezone_0.5.23+dfsg1-1_all.deb ...
Unpacking libjs-moment-timezone (0.5.23+dfsg1-1) ...
Selecting previously unselected package libjs-mustache.
Preparing to unpack .../09-libjs-mustache_2.3.2-1_all.deb ...
Unpacking libjs-mustache (2.3.2-1) ...
Selecting previously unselected package libjs-rickshaw.
Preparing to unpack .../10-libjs-rickshaw_1.5.1.dfsg-2_all.deb ...
Unpacking libjs-rickshaw (1.5.1.dfsg-2) ...
Selecting previously unselected package moreutils.
Preparing to unpack .../11-moreutils_0.62-1_amd64.deb ...
Unpacking moreutils (0.62-1) ...
Selecting previously unselected package prometheus.
Preparing to unpack .../12-prometheus_2.7.1+ds-3+b11_amd64.deb ...
Unpacking prometheus (2.7.1+ds-3+b11) ...
Selecting previously unselected package prometheus-node-exporter.
Preparing to unpack .../13-prometheus-node-exporter_0.17.0+ds-3+b11_amd64.deb ...
Unpacking prometheus-node-exporter (0.17.0+ds-3+b11) ...
Selecting previously unselected package influxdb.
Preparing to unpack .../14-influxdb_1.6.4-1+deb10u1_amd64.deb ...
Unpacking influxdb (1.6.4-1+deb10u1) ...
Selecting previously unselected package influxdb-client.
(Reading database ... 382061 files and directories currently installed.)
Preparing to unpack .../influxdb-client_1.6.4-1+deb10u1_amd64.deb ...
Unpacking influxdb-client (1.6.4-1+deb10u1) ...
Setting up influxdb-client (1.6.4-1+deb10u1) ...
Setting up libio-pty-perl (1:1.08-1.1+b5) ...
Setting up fonts-glyphicons-halflings (1.009~3.4.1+dfsg-1) ...
Setting up libjs-moment (2.24.0+ds-1) ...
Setting up influxdb (1.6.4-1+deb10u1) ...
Adding system user `influxdb' (UID 149) ...
Adding new user `influxdb' (UID 149) with group `nogroup' ...
Not creating home directory `/var/lib/influxdb'.
Adding group `influxdb' (GID 157) ...
Done.
Adding user `influxdb' to group `influxdb' ...
Adding user influxdb to group influxdb
Done.
Created symlink /etc/systemd/system/influxd.service → /lib/systemd/system/influxdb.service.
Created symlink /etc/systemd/system/multi-user.target.wants/influxdb.service → /lib/systemd/system/influxdb.service.
Setting up libjs-d3 (3.5.17-2) ...
Setting up libjs-moment-timezone (0.5.23+dfsg1-1) ...
Setting up libipc-run-perl (20180523.0-1) ...
Setting up libjs-mustache (2.3.2-1) ...
Setting up libjs-jquery-hotkeys (0~20130707+git2d51e3a9+dfsg-2) ...
Setting up libjs-bootstrap (3.4.1+dfsg-1) ...
Setting up libjs-eonasdan-bootstrap-datetimepicker (4.17.47-3) ...
Setting up moreutils (0.62-1) ...
Setting up prometheus-node-exporter (0.17.0+ds-3+b11) ...
Created symlink /etc/systemd/system/multi-user.target.wants/prometheus-node-exporter.service → /lib/systemd/system/prometheus-node-exporter.service.
Created symlink /etc/systemd/system/timers.target.wants/prometheus-node-exporter-smartmon.timer → /lib/systemd/system/prometheus-node-exporter-smartmon.timer.
Created symlink /etc/systemd/system/timers.target.wants/prometheus-node-exporter-apt.timer → /lib/systemd/system/prometheus-node-exporter-apt.timer.
Created symlink /etc/systemd/system/timers.target.wants/prometheus-node-exporter-ipmitool-sensor.timer → /lib/systemd/system/prometheus-node-exporter-ipmitool-sensor.timer.
Created symlink /etc/systemd/system/timers.target.wants/prometheus-node-exporter-mellanox-hca-temp.timer → /lib/systemd/system/prometheus-node-exporter-mellanox-hca-temp.timer.
Setting up libjs-rickshaw (1.5.1.dfsg-2) ...
Setting up prometheus (2.7.1+ds-3+b11) ...
Created symlink /etc/systemd/system/multi-user.target.wants/prometheus.service → /lib/systemd/system/prometheus.service.
Processing triggers for man-db (2.8.5-2) ...
Processing triggers for fontconfig (2.13.1-2) ...
Processing triggers for systemd (241-7~deb10u5) ...
Configuration of Prometheus
Debian will generate a default configuration of the Prometheus package. You can edit it at: /etc/prometheus/prometheus.yml
We should only concern ourselves with the entries below:
# A scrape configuration containing exactly one endpoint to scrape:
# Here it's Prometheus itself.
scrape_configs:
  # The job name is added as a label `job=<job_name>` to any timeseries scraped from this config.
  - job_name: 'prometheus'

    # Override the global default and scrape targets from this job every 5 seconds.
    scrape_interval: 5s
    scrape_timeout: 5s

    # metrics_path defaults to '/metrics'
    # scheme defaults to 'http'.

    static_configs:
      - targets: ['localhost:9090']

  - job_name: node
    # If prometheus-node-exporter is installed, grab stats about the local
    # machine by default.
    static_configs:
      - targets: ['localhost:9100']
After editing the configuration file, we should restart the prometheus service.
$ sudo systemctl restart prometheusThe Prometheus node exporter should already be installed when we installed prometheus package earlier, if not just use apt install prometheus-node-exporter. The Node Exporter will be used to monitor the node itself. If it has not started yet, we can just execute this command on the terminal: sudo systemctl start prometheus-node-exporter The node should now be up and listening on port 9100 and Prometheus will be getting those metrics from http://localhost:9100/metrics. Later we will see them with Grafana.
Configuration of InfluxDB
There should be already default configurations generated by installing the package earlier. We need to enable collectd so the other clients such as OpenWRT can send metrics to InfluxDB.
Editing the configuration and enabling collectd:
$ sudo nano /etc/influxdb/influxdb.conf

# Just modify only the section of collectd, leave the others as-is
[[collectd]]
   enabled = true
   bind-address = ":25826"
   database = "collectd"
   retention-policy = ""
  #
  # The collectd service supports either scanning a directory for multiple types
  # db files, or specifying a single db file.
   typesdb = "/usr/local/share/collectd"
  #
   security-level = "none"
  # auth-file = "/etc/collectd/auth_file"
We now need to download the types.db from collectd, add the missing metrics for stations and put it on the location as indicated on the typesdb file.
$ wget https://raw.githubusercontent.com/collectd/collectd/master/src/types.db
$ echo "stations value:GAUGE:0:256" >> types.db
$ sudo mv types.db /usr/local/share/collectd/types.db
Restart the influxdb service and now we should see opened ports. The InfluxDB listens on TCP port 8086 and collectd on UDP port 25826. Punch a hole in your firewall for those ports.
To check for the ports:
$ sudo netstat -tulpn|egrep "8086|25826"

tcp        0      0 0.0.0.0:8086            0.0.0.0:*               LISTEN      8896/influxd
udp        0      0 0.0.0.0:25826           0.0.0.0:*                           8896/influxd
Creating the collectd database on InfluxDB
$ influx
> CREATE DATABASE collectd
> exit
The influx command will fail if you forgot to install the influxdb-client package.
Installation and Configuration of Grafana
The Grafana server cannot be found on the default APT repository, so we need to use the official Grafana repo from their site. It can be found here: https://grafana.com/docs/grafana/latest/installation/debian/
We will install the the stable community version of Grafana. The following commands below will install dependencies of Grafana, import Grafana’s apt key, repo and finally install Grafana server.
$ sudo apt-get install -y apt-transport-https software-properties-common wget
$ wget -q -O - https://packages.grafana.com/gpg.key | sudo apt-key add -
$ echo "deb https://packages.grafana.com/oss/deb stable main" | sudo tee -a /etc/apt/sources.list.d/grafana.list
$ sudo apt-get update
$ sudo apt-get install grafana
By default the server won’t start automatically, we need to execute the following commands to run the server.
$ sudo systemctl daemon-reload
$ sudo systemctl enable grafana-server
$ sudo systemctl start grafana-server
To determine whether Grafana is running, we can check the port 3000:
$ sudo netstat -tulpn|egrep 3000

tcp        0      0 0.0.0.0:3000            0.0.0.0:*               LISTEN      5992/grafana-server
By default Grafana listens on port 3000, you can change that by editing the configuration file of Grafana at /etc/grafana/grafana.ini. You need to restart Grafana after making changes.
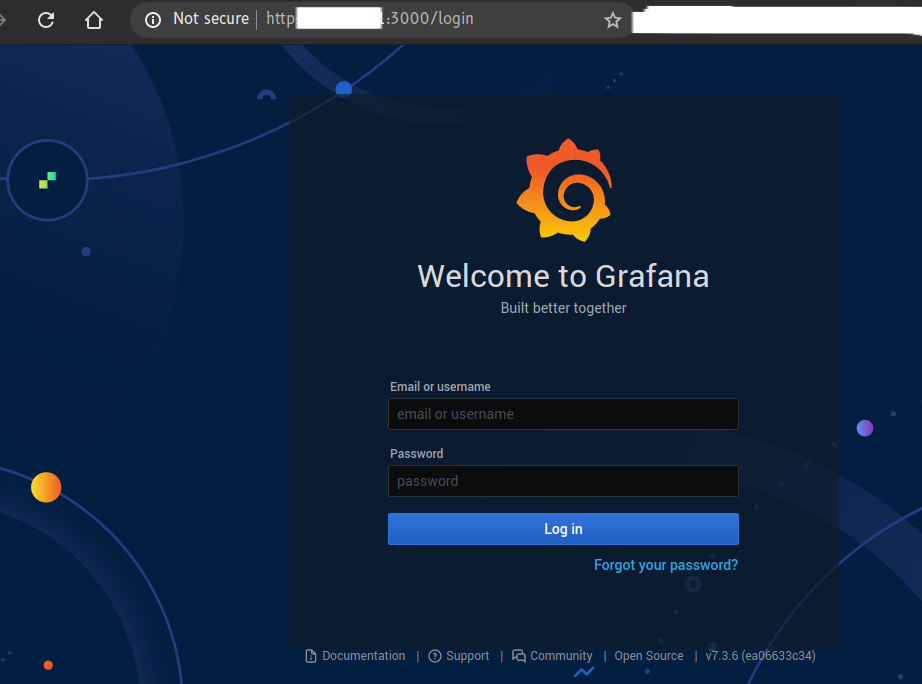
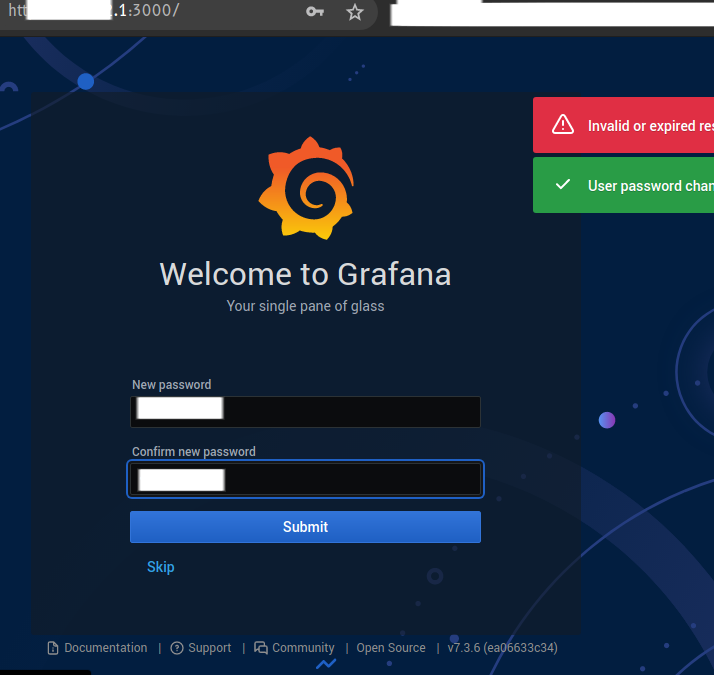
You can now login to the Grafana dashboard, the default credentials are admin:admin, password change is required after logging in for the first time.
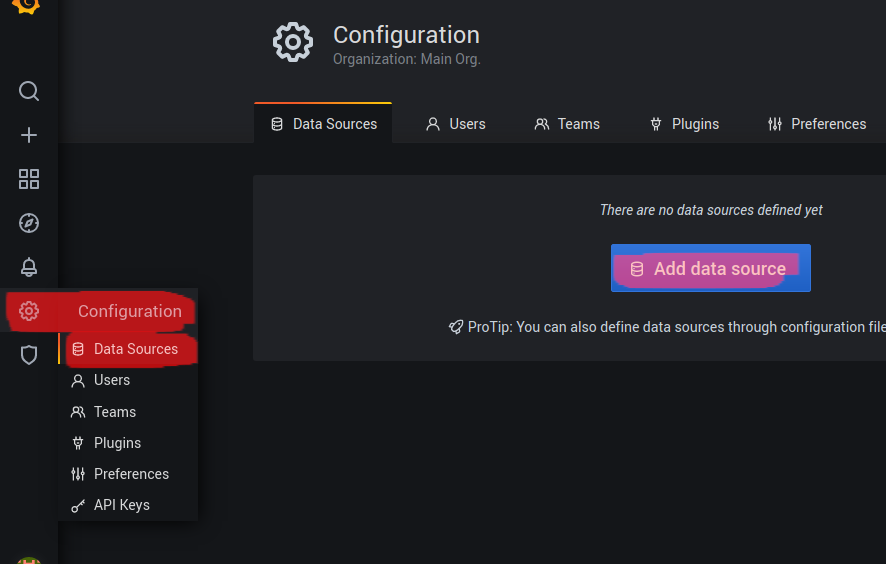
We will now add the two data sources Prometheus and InfluxDB. First, after logging in navigate to the right navigation bar press the gear icon (Configuration) > Data Sources > Add data source.
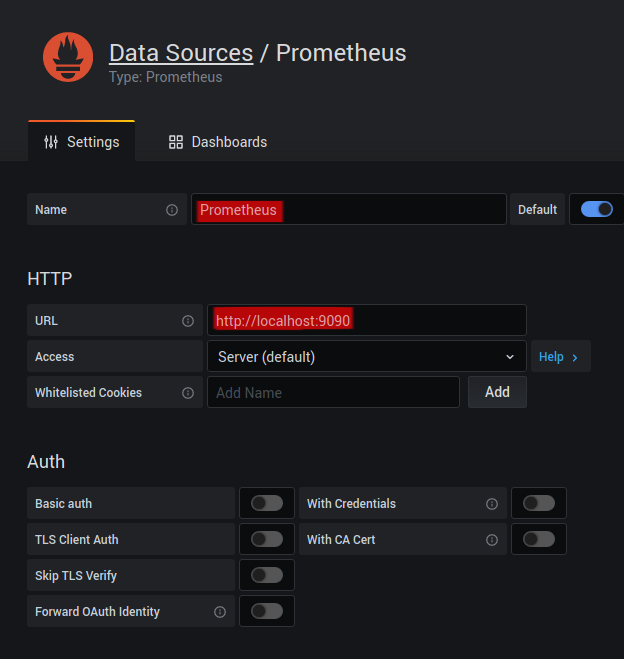
Choose Time series databases > Prometheus, set the URL to http://localhost:9090, Name to Prometheus and HTTP Method to GET.


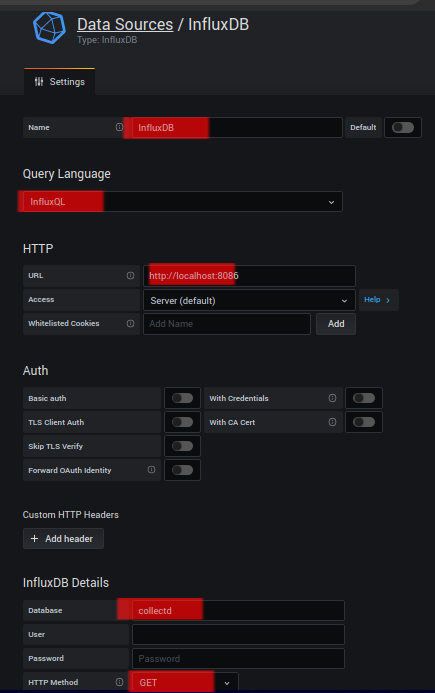
To add the InfluxDB, Add data source again but choose InfluxDB. Under the name you can choose InfluxDB or whatever you want. Then HTTP URL to http://localhost:8086, InfluxDB Details Database to collectd and HTTP Method to GET.
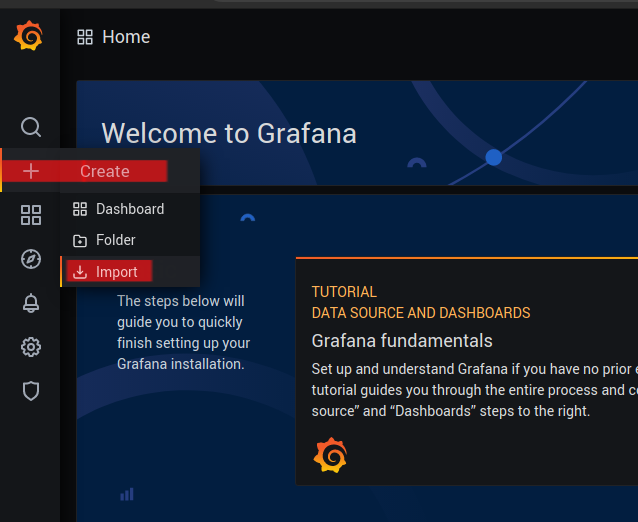
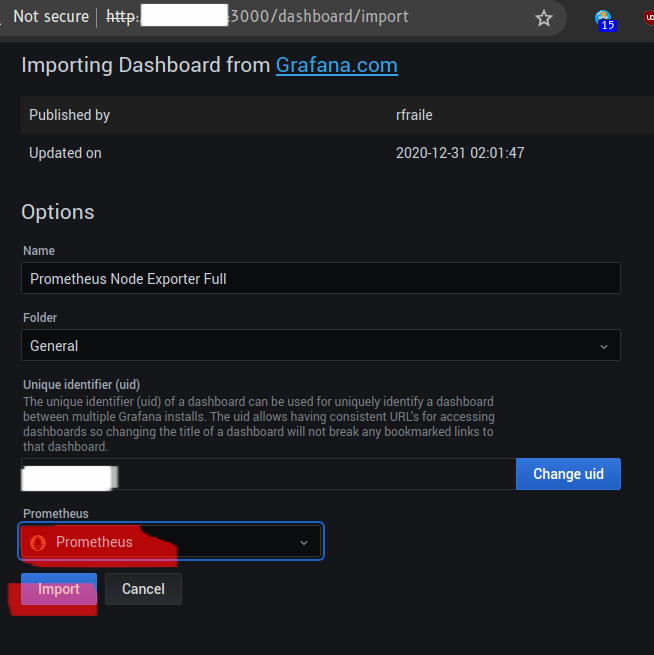
We will now add the node exporter dashboard. Go to Home > click + (Create) > Import. Type the number 1860 on the Grafana.com Dashboard, click Load. This will download the user created dashboard.


After that, select your Prometheus data source from the Prometheus combo box and hit Import. You should now see the dashboard from your node exporter.

You can forward metrics to UDP port 25826 on your monitor node. We will use this to monitor OpenWRT.